What is technical analysis, and what is it for?
Technical analysis studies market data, especially price and volume, to describe trends, ranges and other conditions that might matter to a trading decision. The chart is a record. Your interpretation of it is a hypothesis. Keeping those separate is where I would start.
Suppose a price closes above a previous high. That is something you can check. “Buyers will keep pushing it higher” is a claim about the future. You need more than a confident label to turn the second sentence into a method worth risking money on.
I want this guide to help you read a chart without immediately turning it into a reason to trade. We will use a small invented data set, including a breakout that does not hold, so you can see exactly which information was available at each decision point. You can download the same numbers and check the arithmetic yourself.
This is the foundations page, not a catalogue of entry signals. Once the basics are clear, our guide to choosing a trading strategy helps connect an approach with the time, product and risk you can actually manage.
| Approach | Typical input | A useful question | What it does not establish |
|---|---|---|---|
| Technical | Historical prices, volume and defined calculations. | Is price rising, falling or ranging under my definition? | That a pattern will repeat or a trade will be profitable. |
| Fundamental | Business results, economic conditions and valuation assumptions. | What might affect the asset's value or cash flows? | The exact time or execution price of the next market move. |
Fidelity's introduction describes common chart tools. Their availability on a platform should not be confused with a recommendation to use all of them.
Before drawing a line, check what the chart contains
Start with the instrument, product, provider, time zone and session. A chart labelled “gold” could describe a futures contract, spot quotation or dealer CFD. A cash index is not the same thing as a contract you can place an order in. Similar shapes do not make their prices, spreads or contract values interchangeable.
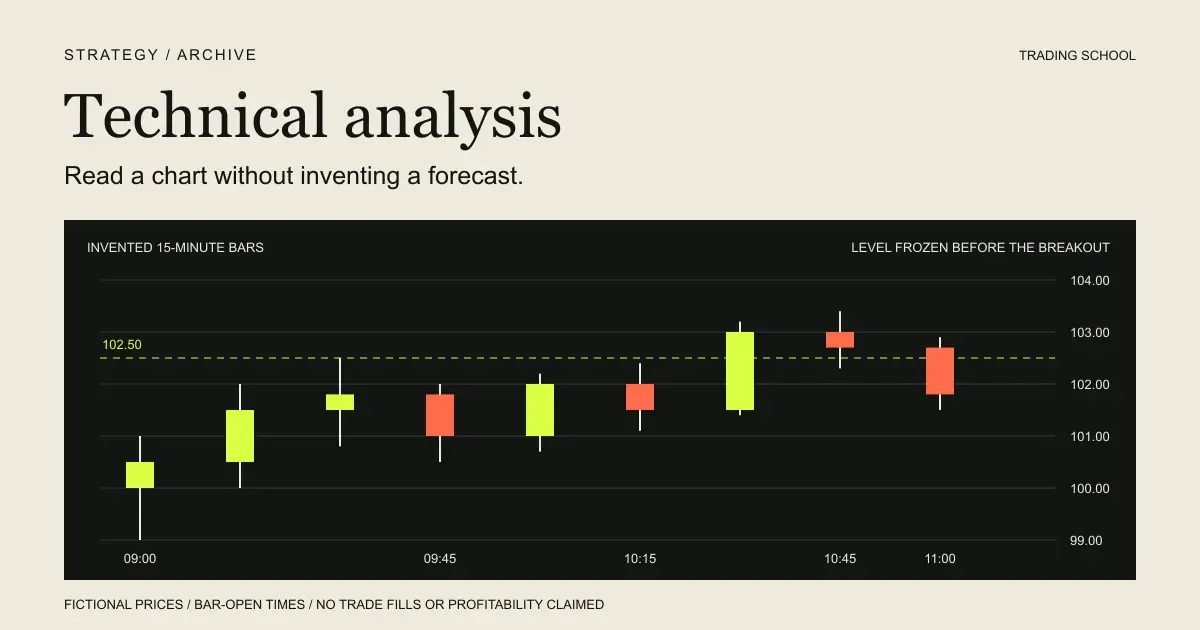
Next check the candle interval. A 15-minute candle summarises one interval, not fifteen separate forecasts. Platforms may label the opening time or closing time. In the example below, the candle labelled 10:30 covers 10:30–10:45, so its final close is not known at 10:30.
A candlestick shows four prices: the open, high, low and close. The body connects open and close; the wicks extend to the high and low. Colours depend on the chart settings. A candle that closes above its open is not proof that the next candle will rise.
For the invented 10:15 bar, open is 102.00, high 102.40, low 101.10 and close 101.50. Its full range is 1.30 price units and its body is 0.50. That describes the interval; it does not reveal the exact order in which every intermediate price traded. CME's chart explanation covers the underlying OHLC structure.
Ask what any volume column measures, too: traded units on a named venue, aggregated activity, or tick updates from a provider. An unexplained “volume” label is not enough to treat the number as a complete picture of a market. Changes in feeds, sessions, corporate-action adjustments or futures-contract series can also alter the history you see.
Trend, support and resistance need definitions, not hindsight
Technical traders often describe an uptrend with higher highs and higher lows, a downtrend with lower highs and lower lows, and a range with repeated movement between areas. Those are useful starting descriptions, but a test needs to say how a high, low or area is selected.
For example, a swing high that requires two later candles to confirm cannot be used as though you recognised it at its peak. The confirmation happens later. That delay belongs in the record. Otherwise the chart quietly gives your historical decisions information they did not have.
Support describes an area where downward movement has previously met buying interest; resistance describes an area where upward movement has previously stalled. Neither is a physical barrier. Choose a reproducible level or zone and record the selection time, rather than redrawing it until the outcome looks obvious.
In this exercise, resistance is simply the highest high of the first six completed bars: 102.50. This is an explicit educational convention, not the uniquely correct way to mark resistance. We freeze it before looking at the following candles. For examples of turning levels into written rules, see our support-and-resistance record.
A higher-timeframe trend and a lower-timeframe pullback can coexist. Pick the role of each timeframe before judging the candidate. Switching charts until one agrees with a trade you already want to take is not confirmation; it changes the question after seeing the answer.
A breakout can be real and still fail to hold
The nine bars below are deliberately invented. They are not a backtest, historical market observation or proof of an edge. All times label bar opens in an arbitrary example-session clock, and all rows represent completed 15-minute bars. Volume is invented traded-unit volume for this fictional single venue.
| Bar opens | Open | High | Low | Close | Volume | SMA(3) |
|---|---|---|---|---|---|---|
| 09:00 | 100.00 | 101.00 | 99.00 | 100.50 | 1,000 | Not available |
| 09:15 | 100.50 | 102.00 | 100.00 | 101.50 | 1,200 | Not available |
| 09:30 | 101.50 | 102.50 | 100.80 | 101.80 | 1,100 | 101.27 |
| 09:45 | 101.80 | 102.00 | 100.50 | 101.00 | 900 | 101.43 |
| 10:00 | 101.00 | 102.20 | 100.70 | 102.00 | 950 | 101.60 |
| 10:15 | 102.00 | 102.40 | 101.10 | 101.50 | 1,000 | 101.50 |
| 10:30 | 101.50 | 103.20 | 101.40 | 103.00 | 1,400 | 102.17 |
| 10:45 | 103.00 | 103.40 | 102.30 | 102.70 | 1,300 | 102.40 |
| 11:00 | 102.70 | 102.90 | 101.50 | 101.80 | 1,600 | 102.50 |
By 10:30, the first six bars have closed, so their maximum high of 102.50 is available. The 10:30 bar then closes at 103.00 at 10:45. That satisfies our description “first close above the frozen level.” It does not tell us the fill price of an order, whether a position is affordable or whether an entry has positive expectancy.
The next bar, opening at 10:45, trades down to 102.30 and closes at 102.70 at 11:00. Under a rule allowing a wick below the level but requiring a close above it, that would count as a test that held on a closing basis. Under a stricter rule prohibiting any trade below 102.50, it would fail. Neither interpretation should be selected after seeing the result.
The bar opening at 11:00 closes at 101.80 at 11:15, below the same frozen level. The hypothesis that subsequent closes would remain above it has now failed. Moving the line down to preserve the bullish story would erase the useful part of the exercise.
| Available after | Checkable observation | What remains unknown |
|---|---|---|
| 10:30 | Six completed bars define the 102.50 reference. | Whether a later bar will break it. |
| 10:45 | The 10:30 bar closed above that reference. | Whether a retest will hold; the execution price of any future order. |
| 11:00 | The 10:45 bar closed above despite trading below intrabar. | Whether the next close will also hold. |
| 11:15 | The 11:00 bar closed below the frozen reference. | Any trade's P&L: no executable entry, size or exit was specified here. |
There is intentionally no profit figure. A chart description is not a complete trade. Before testing an entry, specify the order, timing, expiry, invalidation, exit, quantity and costs. Our day-trading practice guide covers that separate session-planning job.
Download the example data and calculationsUse indicators to answer a question, not decorate a decision
An indicator transforms inputs. Before using it, I would ask: what does this number calculate, what changes it, and what would I do differently without it? If you cannot answer those questions, adding a second indicator will not resolve the first one.
| Tool | What it measures | What not to infer |
|---|---|---|
| SMA / EMA | Average-price behaviour; an EMA weights recent observations more heavily. | A crossover proves that a profitable trend will follow. |
| RSI | Recent price momentum on a bounded scale. | An overbought reading requires an immediate short. |
| ATR | Price variability using true ranges, including gaps. | A higher reading predicts an upward move. |
| Volume | Activity under the provider's stated measurement. | A larger bar identifies who traded or guarantees continuation. |
Moving averages: smoothing is not foresight
A simple moving average is the arithmetic mean of a chosen price series over a chosen window. In our example, the last three closes at the end of the 10:30 bar are 102.00, 101.50 and 103.00: their mean is 102.1667. We use three bars to make the arithmetic inspectable, not because three is a recommended trading parameter.
That value includes the current completed close. A rule using the previous three closes would produce a different number. Specify the convention. As Fidelity's SMA guide explains, smoothing introduces lag. Our trend-following guide treats execution timing separately from the calculation.
RSI and ATR answer different questions
RSI compares recent upward and downward price changes. Readings above 70 or below 30 are common conventions, not automatic reversal instructions. Fidelity notes that RSI can remain at an extreme during a strong trend. ATR instead summarises true range and is not directional; its calculation considers the high-low range and gaps relative to the previous close. Read the ATR definition before treating a volatility reading as a prediction.
Three price-derived indicators agreeing is not necessarily three independent pieces of evidence. It may be three ways of describing the same recent move. Decide what information each tool contributes and test whether it improves decisions after costs, rather than counting green lights.
Does technical analysis work? Ask which rule, market and test
There is a meaningful difference between a pattern containing information and a trader earning money from it. Lo, Mamaysky and Wang's research applied systematic pattern recognition to U.S. stocks and found that some indicators provided incremental information in its historical sample. That is narrower than saying all chart patterns work, or that those findings establish a present-day retail strategy. Read the original research summary.
Another problem is selection. If you try enough settings on the same history and only show the winner, an attractive result may reflect the search process rather than a repeatable effect. Bailey and co-authors examine this problem in The Probability of Backtest Overfitting. Keeping a test set alone is not a cure if you repeatedly inspect it and redesign the method around its results.
For a practical evaluation, freeze the rule version, record every candidate, represent execution delays and costs, and examine different conditions. Keep failed configurations in the research log. Use the backtesting and forward-testing guide for the validation process rather than treating this nine-bar illustration as a sample of performance.
Risk control has a separate job. It limits planned exposure; it does not turn a negative-expectancy rule into a positive one. The Trading Calculator can help with the arithmetic once you know the product's contract value and your invalidation rule. Its output is not a forecast, and an ordinary stop cannot guarantee a maximum realised loss.
A practical way to learn without collecting more indicators
For your next practice session, hide the future candles. Choose one instrument, one timeframe and one definition of a level. Write what you see, what you think might follow, and what would disprove it. Then reveal the next completed candle and preserve the original note.
Keep the language plain. “Price closed above the high of the previous six bars” is checkable. “Smart money has confirmed the next rally” adds a claim you have not measured. Do not confuse a memorable explanation with evidence about who traded or what happens next.
- Can I identify the exact product, feed, session and candle timestamps?
- Was every input available at the time of the decision?
- Would someone else select the same level from my written rule?
- Have I separated the observed event from the predicted outcome?
- Does the plan define a no-trade condition as well as an entry?
- If I test a trade, are order behaviour, size and costs specified?
- Will I retain the failed candidates, not only the clean-looking charts?
Save the record in your trading journal. If you want to turn a chart interpretation into a reusable method, the strategy template gives you a place to define its conditions and limitations.
You do not need a convincing opinion on every chart. Sometimes the useful result is that the data is unclear, the rule is incomplete, or there is no candidate worth testing. Technical analysis becomes more useful when it makes those limits visible instead of hiding them behind another indicator.
Questions worth answering
What is technical analysis in simple terms?
Technical analysis studies historical market data, mainly price and volume, to describe market behaviour and formulate possible trading decisions. A chart can show what happened and help define conditions to test. It cannot establish that the next price move will follow your interpretation.
Does technical analysis actually work?
Some technical rules have shown useful information in particular research samples. That does not validate every pattern, indicator or market. A usable trading method needs explicit rules, realistic execution and costs, testing beyond the data used to choose it, and risk controls. A convincing chart alone is not evidence of a profitable edge.
What should a beginner learn first in technical analysis?
Start with the exact product and data feed, candle open/high/low/close, completed versus forming bars, market structure and clearly defined levels. Then learn what one indicator calculates. Practise recording an observation, a conditional hypothesis and the condition that would invalidate it before adding more indicators.
Which technical indicator is best for beginners?
There is no universal best indicator. A moving average describes an average-price trend, RSI describes recent price momentum, and ATR describes price variability rather than direction. Choose a tool for a defined question; stacking calculations from the same prices does not create independent confirmation.
Is technical analysis the same as fundamental analysis?
No. Technical analysis focuses on market data such as price and volume; fundamental analysis considers the underlying business, asset, economy or valuation. They address different questions and can be combined, but neither makes an individual trade certain.
Can I use the same chart rules for forex, gold, indices and Bitcoin?
The vocabulary can transfer, but the product specifications, trading sessions, liquidity, costs and data can differ. A cash index, futures contract and CFD are not interchangeable. Recheck the rules on the exact product and timeframe; do not transfer a backtest or position size simply because the charts look similar.
Can AI do technical analysis for me?
AI can help explain a calculation or check whether a written rule has been described consistently. Verify chart readings against the underlying data, especially timestamps, prices and whether candles are complete. An AI explanation is not a trade signal or evidence that a strategy works. Strategy Archive's AI Market Analyzer beta is currently closed.
Sources and scope
- CME Group: Technical Analysis
Chart types and the open, high, low and close information represented by bars and candles.
- Fidelity: What Is Technical Analysis?
Overview of price-based analysis, moving averages and other common tools; not evidence for the invented example.
- Fidelity: Simple Moving Average
The mean-price calculation and smoothing lag.
- Fidelity: Relative Strength Index
Momentum interpretation and the warning about persistent extreme readings.
- Fidelity: Average True Range
True-range construction, gaps and non-directional volatility measurement.
- Lo, Mamaysky and Wang: Foundations of Technical Analysis
Original empirical research, NBER working paper 7613, 2000; historical sample findings are not current profitability guarantees.
- Bailey et al.: The Probability of Backtest Overfitting
Research on selecting strategies through historical simulations and the limitations of validation procedures.
Research cutoff: October 20, 2026. All nine bars, volume values and the 102.50 reference example are invented educational data. No real trades, personal performance, tested win rate or profitable edge are claimed. This is general education, not a trade signal or personalised investment advice.