What is fundamental analysis?
When beginning to understand fundamental analysis, you should ask yourself: what has changed?
Even if the headline is positive, the market can sometimes react negatively. Interest rates could fall yet the currency still goes up. Inflation could have slowed but prices have still risen significantly from last year.
By looking at what the number was, what was expected and what investors may have interpreted, we can make more sense of this. In this guide I will show you how to approach it without trading based on every piece of economic news.
Fundamental analysis looks at the broader factors that affect a market. For stocks, you will look at factors such as revenue, margins, debt, cash flow, valuation and competition. For currencies, it focuses on monetary policy, inflation, activity and how these compare with another country or currency area.
This article focuses on macroeconomic fundamental analysis to understand the impact economic news and policy can have on currencies, stock indices and gold. This is not a complete guide to valuing a business.
Fundamental analysis vs news trading
You can use economic information to understand the market and manage your exposure. News trading is more specific: looking to trade the price movement associated with an announcement.
You do not have to trade the release to benefit from understanding it.
Why good economic news can cause the market to go lower
A company could have a higher profit than last year, but if investors were expecting a much bigger improvement, they may be disappointed. Economic releases can be the same.
An increase in employment could be seen as a sign of strong demand. This could also lead investors to think there is less reason for the central bank to cut interest rates. The implications can pull in different directions.
Instead of only looking at whether it was better or worse than last month, compare it with expectations. What was different, and why might that matter?
An economic surprise is the difference between market expectations and the actual release. CME Group's analysis of economic releases examines that difference in relation to subsequent trading activity. It does not turn a surprise into a guaranteed price direction.
This is a good habit to get into: look at what was expected before deciding what the result means.
How to read an economic calendar
An economic calendar can be a helpful tool for keeping track of releases. However, the calendar alone will not explain what the release measures. Most calendars show the following information.
| Name | Description | Check |
|---|---|---|
| Actual | The new number. | Have I got the right series? |
| Forecast / consensus | A summary of expectations from this provider. | When was this recorded? How was it calculated? |
| Previous | The previous period's number. | Was this the original result or an updated one? |
| Revised | A change to a previously published number. | Does this change the story suggested by the new headline? |
Consensus numbers are not an official promise. Different providers may survey different forecasters, and some update their numbers at different times. Take note of the provider and the pre-release figure so you can review how you interpreted it.
Check the units. A percentage change per month is not the same comparison as a percentage change per year. A level is not a growth rate. Seasonally adjusted numbers are not interchangeable with unadjusted ones.
If inflation is reported as 0.3% month over month (MoM) and 3% year over year (YoY), those numbers describe different periods. Compare each result with its matching forecast rather than mixing the two.
Check the time and time zone. Daylight saving can temporarily change the time difference between your country and the country releasing the data. Always check the official schedule.
What economic information should you learn first?
You will not need to know about every release. Begin with the ones that answer the most important questions for your market.
1. Inflation — what is happening to prices?
Inflation measures the change in a price index. It does not mean all households are paying the same amount extra.
In the United States, CPI measures price changes across a basket of consumer goods and services. Headline CPI includes food and energy, whilst core CPI excludes those categories. The BLS explanation of CPI makes clear that food and energy remain part of the headline measure.
A common confusion is the difference between a slowdown in inflation and falling prices. If annual inflation slows from an invented 4% to 3%, the measured price level is still higher than a year ago, but it is rising more slowly. That is different from deflation, a fall in the price level.
When reading an inflation release, ask: what were the monthly and yearly changes? Was it headline or core? What contributed to the number? Did it differ from expectations?
Some historical figures can change. BLS updates seasonal factors each year, meaning previously published seasonally adjusted CPI figures can be revised.
2. PCE inflation — not CPI!
The Personal Consumption Expenditures price index, or PCE price index, is released by the U.S. Bureau of Economic Analysis. It measures prices for goods and services purchased by U.S. consumers or on their behalf. Its coverage and calculation differ from CPI. See the BEA explanation of the PCE price index.
As a beginner, make sure you know what the release is called. A core CPI forecast is not the right comparison for an actual headline PCE result.
3. Employment — look beyond the payroll number
The U.S. employment report contains several pieces of information, and they are not all from the same survey.
The establishment survey measures payroll employment, hours and earnings. The household survey provides measures such as the unemployment rate. They cover different populations and concepts, so they can give different short-term impressions of the labour market. BLS compares the surveys here.
Then check revisions. In a fictional example, payroll growth is expected to be 180,000 and comes in at 200,000. However, the previous two months are revised down by 25,000 and 35,000.
The latest month was 20,000 above expectations, while the earlier months were revised down by a combined 60,000. This is not a simple buy/sell calculation. It shows why you should not look only at the latest headline.
The Employment Situation FAQ explains that initial payroll estimates are revised in the following two months as more information becomes available. There is also separate annual benchmarking.
4. Central-bank decisions — more than one piece of information
A central-bank meeting can include the rate decision, policy statement, forecasts where provided, and comments during a press conference. Even if the rate stays the same, there could still be a significant change in the policy outlook.
Officials could leave today's rate unchanged but show greater concern about inflation. Or they could leave it unchanged while becoming more concerned about a weak economy.
The Federal Reserve's explanation of monetary policy describes how policy affects financial conditions through interest rates, asset prices and exchange rates. Expectations about future policy also play a role.
- Hawkish: a message favouring tighter policy, or less easing, relative to the comparison being made.
- Dovish: a message favouring easier policy, or less tightening.
These are relative terms. A decision can leave policy restrictive but still be more dovish than expected.
5. Growth — what is the GDP number showing?
GDP measures production in the economy. When analysing it, check whether real, inflation-adjusted growth or nominal growth is being shown.
BEA generally presents changes in its featured seasonally adjusted quarterly GDP series at annualised rates. That is different from the actual percentage change over that single quarter. Its GDP definitions and statistical conventions explain the distinction and how estimates are updated as more complete data arrives. The advance estimate is not a final, fixed number.
Has growth improved? Has its make-up changed? Does this change how you see the economy?
Interest-rate expectations and market sentiment
You will often hear the phrase “it is priced in.” This does not mean all traders agree or that you know what the next move will be. It means prices already reflect some expectations.
A widely expected decision may be less surprising than an unexpected one. However, the statement can still change expectations for future meetings.
One way to observe this is CME FedWatch. It uses 30-Day Fed Funds futures prices to calculate probabilities for possible policy-rate outcomes under its methodology. These are market-implied estimates. They are not promises from the Fed or the probability that your trade will win.
Use it to take note of how expectations have changed. The ECB's explanation of monetary-policy transmission also describes how expectations influence longer-term interest rates, and how policy can affect asset prices and exchange rates. The timing and size of the economic effects are uncertain.
An example of how to analyse an inflation surprise
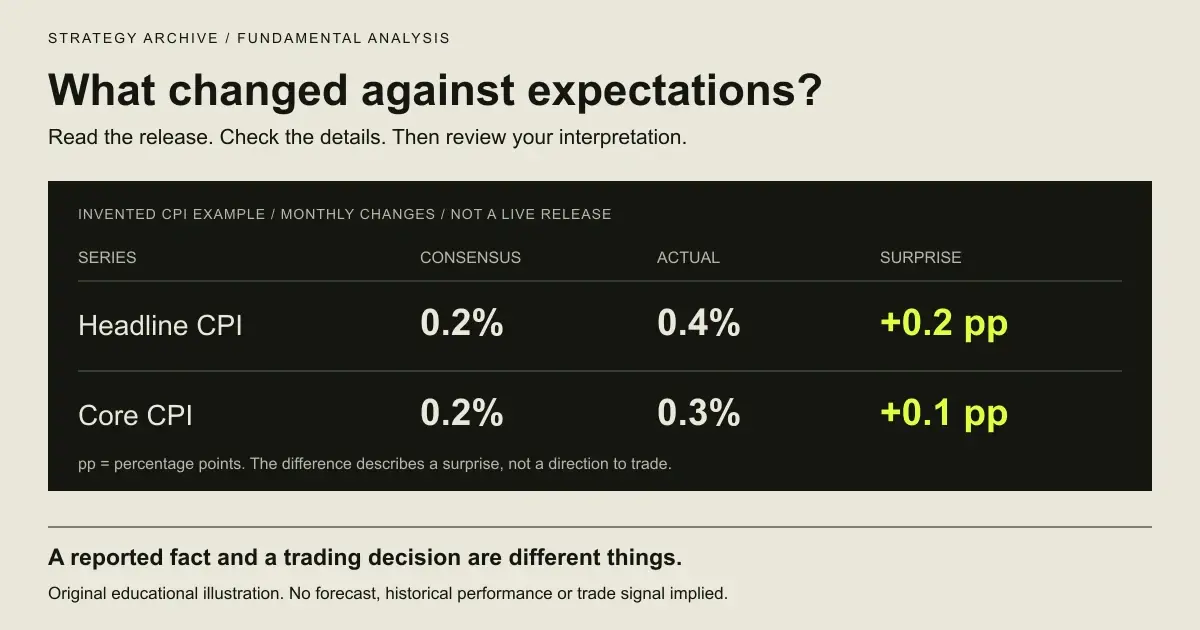
The numbers below are made up for this example. They are not a historical release, backtest or trading recommendation. Both rows describe monthly percentage changes.
| Monthly measure | Consensus | Actual | Surprise |
|---|---|---|---|
| Headline CPI | 0.2% | 0.4% | +0.2 percentage points |
| Core CPI | 0.2% | 0.3% | +0.1 percentage points |
Headline CPI exceeded the recorded consensus by 0.2 percentage points; core CPI exceeded it by 0.1 percentage point. Those differences are measured in percentage points, not relative percentage increases.
- Fact: both readings were higher than the recorded forecasts.
- Detail: what contributed to the numbers? Was the change widespread or concentrated? Does it fit a trend?
- Conditional interpretation: this could increase concern about sustained inflation and change monetary-policy expectations.
- Observation: what has repriced? Have rate expectations changed? What happened to the relevant currency and asset? Was another announcement involved?
- Execution: a reasonable interpretation still does not specify your entry, stop, size or holding period.
“Inflation was higher than expected” and “buy the dollar now” are completely different statements. The second requires evidence and a complete trading method.
Download the fictional example dataWhat does this mean for different markets?
The same announcement can affect different assets through different channels. Ask yourself the following questions rather than using the table as a directional rule.
| Market | Questions to ask |
|---|---|
| Forex | How has this changed the outlook for one economy and its policy rates relative to the other currency? |
| Stock indices | What could this mean for earnings expectations, financing conditions and valuations? |
| Gold | How are real yields, the dollar and demand for protection or diversification changing? |
| Individual stocks | Has this changed expectations for the company's revenue, costs, financing or competitiveness? |
A currency pair is a relative price. If you only look at U.S. data for EUR/USD and ignore euro-area developments, you leave half the comparison unfinished.
Gold needs more attention than “inflation up, gold up.” Real yields can change the opportunity cost of holding a non-yielding asset. Other demand factors can pull in a different direction. CME Group's discussion of gold specifically notes that its relationship with real yields is imperfect.
Stock indices can be similar. Stronger demand can support earnings expectations whilst tighter financing conditions can hurt valuations. A plausible economic story does not establish which effect will dominate.
A simple fundamental-analysis routine
Keep it simple enough to apply consistently.
Before the release
Note what you expect to learn. What is the exact event, series, time and official source?
- Record the consensus number, provider and pre-release snapshot time.
- Record the relevant previous number and whether it has already been revised.
- Identify nearby announcements that could complicate the interpretation.
- Identify the exact product you are observing.
- Write your policy for existing positions and new entries.
Ask yourself a question: will this inflation report strengthen or weaken the argument for the policy path currently reflected in market pricing?
That gives you something to analyse. “I think gold will go up” gives you a direction to become attached to.
During the release
Read the official release. Do not build a story only from somebody else's summary.
Make sure you know the series, units, period, actual number and revisions. If you cannot confirm a number, mark it as unconfirmed.
You do not need to be the fastest at interpreting the headline. If your routine relies on getting in ahead of professional systems, you are taking on a different challenge.
After the release
Choose your observation window before reviewing the reaction. For a paper exercise, you might record the price just before the event, five minutes after and thirty minutes after.
These are examples of a recording convention, not recommended entry times. Note the price source, timestamp and whether it is a bid, ask, mid-price or traded price. Record any overlapping news.
Just because price moves after the release does not mean your favoured explanation caused it. Record alternative explanations.
Keep a short event log
- Event and exact series.
- Official source and release time.
- Consensus provider and pre-release number.
- Actual result and revisions.
- My interpretation.
- What could contradict it.
- Market reaction and observation window.
- What I did, including not trading.
- What I need to investigate next.
Our trading journal guide will help you structure your notes. The aim is to see whether you interpret information consistently, rather than collect convincing explanations after the event.
Download the economic-event worksheetUsing fundamentals and technicals together
Fundamentals and technicals can play different roles. Fundamentals help you understand economic factors and changing expectations. Technicals help you describe price action and create testable conditions.
You may record a change in policy expectations but still require a specific chart setup before considering an entry.
Do not use either as an excuse. If your chart criteria are not met, a good economic argument does not justify repeatedly moving your stop. If the release does not fit your original interpretation, a favourable chart pattern does not make that contradiction disappear.
Our technical analysis guide explains the difference between what you see on a chart and evidence of an edge. Write the full decision process in your trading plan.
Risk remains even when you understand the news
Your interpretation may be reasonable whilst the trade is unattractive. The entry may be poor, liquidity uncertain, or the price may change before your order arrives. Do not assume the stop price is a guaranteed execution price.
The Investor.gov guide to stock orders explains that a triggered stop order becomes a market order and may execute away from the stop price. A stop-limit order constrains the execution price but may remain unfilled. Check the relevant rules for your product and provider; do not assume stock-order guidance describes every venue or dealer contract.
If you trade a prop-firm account, check its current news restrictions and funded-stage requirements. Being able to place an order on the platform does not mean the trade complies with the program contract. See our funded-account risk management guide for the separate job of budgeting loss headroom.
The Trading Calculator can help with position-size arithmetic once you have your risk budget. It cannot guarantee a fill or determine whether your provider permits the trade.
Not trading can be a valid choice.
Mistakes to avoid from the start
- Thinking a calendar colour tells you to buy or sell. Green does not mean all relevant markets should rise.
- Only reading the headline. Revisions, components and other figures may change the interpretation.
- Confusing expected with actual. Keep “the report shows” separate from “I think this could imply.”
- Changing the story for every candle. Record the original interpretation and what could contradict it.
- Thinking a macro opinion lets you wait forever. Conviction does not remove position risk or establish when to trade.
- Believing more information means better decisions. Begin with a few relevant releases. Add another when you understand which question it helps answer.
Questions worth answering
Is fundamental analysis better than technical analysis?
Neither is universally better. They answer different questions. The useful approach depends on the market, timeframe and whether you can define, test and execute a method after costs. An economic explanation or chart pattern alone does not establish an edge.
Do I have to trade the news to use fundamental analysis?
No. You can use it to understand the market, review exposure, create scenarios or avoid events your strategy does not handle. Understanding a release does not require entering a trade when it arrives.
What should I begin with as a beginner?
Begin with one market and the relevant economic questions. For a currency pair, look at both economies. Learn a few releases well before expanding your calendar, and check the exact series, units, expectations and revisions.
Why could the market move against me despite a positive release?
The result may have disappointed expectations, other figures may conflict with the headline, or investors may focus on a different implication. An immediate price move does not establish which explanation caused it. Record alternative explanations instead of assuming that a positive headline means a higher price.
Can AI do fundamental analysis for me?
AI can help you understand terminology, compare documents and organise a release. Verify figures, dates, revisions and quotations against the original source. Keep facts separate from interpretations. A confident AI summary is not proof of accuracy, a forecast you can rely on, or a trading signal.
What I want you to take from this
You do not need to predict every announcement to understand your market better.
Start with what the release measures. Compare it with a recorded expectation. Read the details and revisions, then explain what might have changed and what remains uncertain.
After that, make a separate decision about whether your method has anything to do. The outcome can be a trade, a question to research, or no action.
That is the approach I want Strategy Archive to encourage: an interpretation you can examine and a decision you can review.
Sources and scope
- CME Group — How FX, Equities Trade Economic Data Sets
Economic surprises and trading activity; not evidence of a guaranteed directional rule.
- BLS — Common Misconceptions about CPI
Headline and core CPI coverage.
- BLS — Seasonal Adjustment in the CPI
Annual seasonal-factor updates and revisions to adjusted data.
- BEA — Personal Consumption Expenditures Price Index
Definition and scope of the PCE price index.
- BLS — Comparing Household and Payroll Surveys
Differences between labour-market measurements.
- BLS — Employment Situation FAQ
Payroll revisions and benchmarking; this page updates with releases.
- Federal Reserve — Monetary Policy: Goals and Transmission
Financial conditions and expectations; no current rate forecast is made here.
- BEA — GDP Release Additional Information
Real versus nominal figures, annualised rates and updates.
- CME Group — FedWatch User Guide
Futures-implied policy outcomes, not probabilities of trade success.
- ECB — Transmission Mechanism of Monetary Policy
Expectations, asset prices and uncertain economic transmission.
- CME Group — Through the Lens of Gold
Gold, real yields and other influences; relationships can diverge.
- Investor.gov — Stop and Stop-Limit Orders
Stock-order execution risks. Check the actual contract and venue for other products.
Sources checked October 27, 2026. Numerical scenarios and the diagram are fictional educational examples, not personal trading results or a profitable backtest. This is educational content, not individual financial advice.