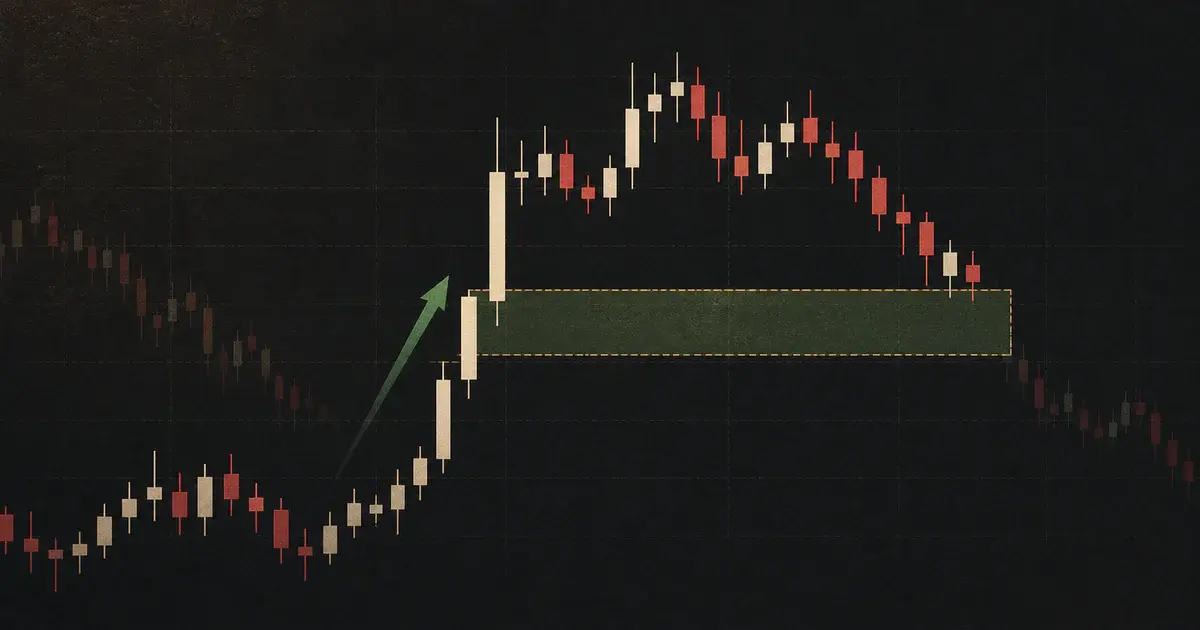
Fair value gap: the quick answer
A fair value gap (FVG) is a three-candle pattern. In a bullish FVG, candle three's low is above candle one's high. In a bearish FVG, candle three's high is below candle one's low. Traders mark the non-overlapping interval and watch for a later retracement. The pattern is a location, not a standalone buy or sell signal, and no credible rule says every FVG must fill.
What is a fair value gap in trading?
In ICT and smart-money-concept vocabulary, a fair value gap is the price interval left between the wick of the first candle and the wick of the third candle after a strong middle candle. The name can be misleading: it is not a calculation of an asset's fundamental fair value, and it does not reveal who traded.
A chart FVG is also different from a conventional exchange gap. TheCME glossary defines a price gap as an interval between bars where no trades take place. In an FVG, the large middle candle normally traded through the highlighted interval. The pattern only says that candles one and three did not overlap there.
Market-microstructure research does support the broader idea that imbalances in buying and selling activity matter. Cont, Kukanov, and Stoikov found a relationship between short-horizon price changes and order-flow imbalance in their study of 50 US stocks. Read the originalorder-book study. That research does not validate the retail FVG pattern, prove that institutions left orders in a rectangle, or establish that gaps forecast future returns.
Directly observable
The high-low relationship of three completed candles on one named data feed.
A testable hypothesis
Whether a qualified revisit produces useful entries in a specific market and regime.
Not proven by the chart
Institutional intent, hidden orders, a guaranteed reaction, or a universal fill rate.
How to identify bullish and bearish fair value gaps
Number three consecutive completed candles from left to right. Use their wicks, not only their bodies. The middle candle is usually a relatively large directional candle, often called displacement, but size is a separate filter rather than part of the basic geometry.
Bullish fair value gap
Candle 3 low > Candle 1 high
The FVG extends from candle 1 high (lower boundary) to candle 3 low (upper boundary).
Bearish fair value gap
Candle 3 high < Candle 1 low
The FVG extends from candle 3 high (lower boundary) to candle 1 low (upper boundary).
FVG identification checklist
- Wait until candle three has closed; otherwise the pattern can disappear.
- Use the same OHLC feed for detection, testing, and execution decisions.
- Record whether your definition uses wick overlap or a body-only variation.
- Set a minimum gap size in ticks, points, percentage, or ATR units.
- Define whether a touch, midpoint, or full traversal counts as a fill.
- Define how many bars an untouched zone remains eligible for entry.
A fair value gap trading strategy you can actually test
The rules below are a research template, not a claim of profitability. Their purpose is to remove hindsight and make every decision observable. Test long and short rules separately because market behavior may not be symmetrical.
Fix the market, session, and timeframe
Example: NAS100 CFD, 15-minute candles, 09:30-16:00 New York time. Do not mix cash-index, futures, and CFD data in one test.
Define directional context
One mechanical example is long-only when EMA 50 is above EMA 200 and short-only when EMA 50 is below EMA 200. Structure-based bias can be used instead, but it needs equally precise rules.
Qualify displacement
Require the middle candle's real body to be at least 1.25 times ATR(14), then require the three-candle wick formula. The 1.25 threshold is only a starting hypothesis; optimize cautiously and validate out of sample.
Wait for the first revisit
Only consider the first return to the zone within the next 20 completed bars. This avoids repeatedly treating an old, heavily traded zone as fresh.
Require confirmation
For a bullish setup, price enters the zone and a completed candle closes back above its upper boundary. Reverse the rule for a bearish setup. Enter at the next bar's open in a backtest to avoid look-ahead bias.
Set invalidation before entry
For a bullish test, place the logical invalidation below the lower FVG boundary plus a fixed volatility buffer, such as 0.10 ATR. Reverse for shorts. A structural swing stop is another valid test, but do not switch methods after seeing the outcome.
Use one exit rule
Test either a fixed target such as 2R, the prior swing, or a trailing rule. Record each as a separate strategy version instead of choosing the most favorable target trade by trade.
These parameters are not optimized recommendations
EMA periods, ATR thresholds, expiry bars, stop buffers, and targets are explicit example inputs so the idea can be falsified. A parameter that looks best on one historical sample may be overfit. Compare nearby values and reserve unseen data for validation.
Worked bullish FVG example with entry, stop, and target
Assume candle one's high is 100.00 and candle three's low is 102.00. The bullish FVG is therefore 100.00-102.00. Later, price trades into the zone and a confirmation candle closes at 102.30.
| Decision | Example value | Reason |
|---|---|---|
| Entry | 102.40 | Illustrative next-bar execution after confirmation |
| Stop | 99.80 | Below the 100.00 lower boundary with a buffer |
| Risk per unit | 2.60 | 102.40 entry minus 99.80 stop |
| 2R target | 107.60 | 102.40 plus two times the 2.60 risk |
Position size follows the stop
If the maximum planned account risk were $50, the raw unit calculation would be $50 / $2.60 = 19.23 units. Real sizing must then account for the instrument's contract size, tick or pip value, account currency, spread, commission, slippage, and the broker's permitted quantity increments. Never copy the raw number to an order ticket without verifying those specifications.
Do FVGs work on NAS100, US30, gold, forex, and Bitcoin?
FVGs can be detected on any OHLC chart, but detectability is not profitability. The same timestamp can produce different candles across a cash index, futures contract, CFD, forex dealer, or crypto exchange. Treat each feed as a separate dataset.
| Market | Control in your test | Common source of mismatch |
|---|---|---|
| NAS100 / US30 | Instrument type, New York session, opening minutes, roll rules | Cash index, futures, and CFDs use different price construction |
| Gold / XAUUSD | Dealer feed, rollover period, macro-release window, spread | OTC quotes and exchange-traded gold futures are not identical |
| Forex | Broker timezone, Sunday candles, rollover, news filters | There is no single centralized retail spot-FX candle feed |
| Bitcoin / BTCUSD | Exchange, spot vs perpetual, 24/7 sessions, weekend regime | Exchange-specific prices, liquidity, and funding mechanics |
5 minute
More samples and faster feedback, but greater noise, spread, and execution sensitivity.
15 minute
A practical intraday research interval, still sensitive to session definitions and news.
1 hour
Fewer setups and wider stops; useful for testing whether context survives lower-timeframe noise.
4 hour
Much smaller sample counts and longer holding periods; rollover and weekend treatment matter.
For OTC forex, theCFTC explains that the dealer controls the platform and displayed prices. This is one reason an FVG visible on one broker's chart may differ on another.
Fair value gap vs order block, price gap, and liquidity sweep
These terms are often combined online, but each describes a different chart condition. Keeping them separate makes your rules easier to test and prevents a losing setup from being re-labeled after the fact.
| Concept | Working definition | What it tells you | What it does not prove |
|---|---|---|---|
| Fair value gap (FVG) | Three-candle wick non-overlap | Where a fast candle sequence left a visible chart imbalance | Resting institutional orders or a future fill |
| Conventional price gap | One bar trades entirely above or below the preceding bar | A price interval between bars with no recorded trades on that feed | That the gap must close |
| Order block | A framework-specific origin candle or zone before a move | A discretionary area some traders use for context | Actual institutional inventory |
| Liquidity sweep | Price trades beyond a prior high or low and then reacts | That a visible extreme was breached | Why the breach occurred or that reversal will continue |
| Inverse FVG | A failed FVG monitored from the opposite side | Where a prior imbalance rule changed state | That the zone has become support or resistance |
If the level breach is the part you want to study, use the separate guide to the liquidity sweep trading strategy for objective reclaim, confirmation, invalidation, and backtesting rules.
Do fair value gaps always get filled?
No. Price can miss the zone, touch only its edge, reach the midpoint, fully cross it, or return after so much time that the original setup is no longer relevant. Any claimed fill rate is meaningless without a fill definition and time limit. A study that counts an eventual touch years later is answering a different question from an intraday strategy that expires after 20 bars.
How to backtest a fair value gap strategy
Start by writing a data dictionary. Every label must have one meaning before results are visible. Then separate rule development from validation. For a fuller workflow, read our guide tobacktesting vs forward testing.
Record for every occurrence
- Instrument, venue or broker feed, timezone, session, and timeframe
- Bullish or bearish direction and exact gap boundaries
- Gap size in points, percentage, and ATR units
- Displacement size, trend state, and distance from recent structure
- Bars until first touch, midpoint, full fill, invalidation, or expiry
- Entry, stop, target, maximum favorable and adverse excursion
- Spread, commission, slippage, funding, and rejected or missed trades
Protect the test from bias
- Detect the FVG only after candle three closes.
- Do not delete zones that fail or add confirmation after a loss.
- Keep an untouched out-of-sample period for final evaluation.
- Test nearby parameters instead of reporting only the best combination.
- Forward test on the same feed and execution conditions you plan to use.
- Report drawdown, expectancy, sample size, and costs - not only win rate.
TheNFA's guidance on hypothetical performance warns that simulated results benefit from hindsight and may not account fully for liquidity, slippage, financial risk, or a trader's ability to follow the program through losses. Those limitations apply even when a chart setup looks unambiguous.
Common FVG trading mistakes
Calling every large candle an FVG
The candle-one and candle-three wick ranges must actually be non-overlapping under your definition.
Entering before candle three closes
An unfinished candle can remove the gap, creating look-ahead bias between chart review and live trading.
Assuming price must return
A zone can remain untouched or fail immediately. Waiting forever is not a trading rule.
Ignoring the data feed
A broker, futures exchange, and crypto venue can print different highs and lows at the same time.
Moving invalidation after entry
A wider stop changes the strategy and position risk. Define the failure point before placing the trade.
Optimizing only for win rate
A high win rate can hide large losses, poor reward-to-risk, costs, or severe drawdown.
Mixing first-touch and inverse FVG rules
They are different hypotheses with different state transitions and need separate results.
Treating chart language as evidence
Terms such as smart money or institutional footprint do not identify actual participants without order-book data.
Use chart analysis as a second opinion
Strategy Archive's AI Market Analyzer compares chart context with explicit rule sets and explains why a setup is ready, conditional, or absent. It does not place orders or promise an outcome.
Fair value gap trading FAQ
What is a fair value gap in trading?
A fair value gap, or FVG, is a three-candle chart pattern. A bullish FVG exists when the low of candle three is above the high of candle one. A bearish FVG exists when the high of candle three is below the low of candle one. The non-overlapping price interval becomes a zone that traders may monitor for a retracement.
Do fair value gaps always get filled?
No. Price may touch an FVG, partially enter it, trade through it, or never return. Published universal fill-rate claims are not reliable unless they define the market, data feed, timeframe, session, fill condition, look-ahead period, and costs. Test the exact definition you intend to trade.
Do fair value gaps work in forex, gold, and crypto?
The three-candle geometry can appear on forex, XAUUSD, crypto, index, stock, and futures charts. That does not prove the same trading rule has an edge in every market. Feed construction, trading hours, spread, volatility, and liquidity differ, so each market and timeframe requires a separate test.
What is the best timeframe for fair value gap trading?
There is no universally best timeframe. Five-minute charts produce more observations but more noise and cost sensitivity. Fifteen-minute charts can reduce some noise, while one-hour and four-hour charts produce fewer setups with wider price risk. Choose a timeframe that matches your holding period and test it independently.
Do fair value gaps use candle wicks or bodies?
The common FVG definition compares candle wicks: candle-one high with candle-three low for a bullish FVG, and candle-one low with candle-three high for a bearish FVG. Body-only variants are different patterns and should be labeled and tested separately.
What is the difference between a fair value gap and an order block?
An FVG is a non-overlap relationship across three candles. An order block is a separately defined candle or price area that some price-action frameworks associate with the origin of a move. The concepts can overlap on a chart, but they are not interchangeable and neither is a verified order-book record.
What is an inverse fair value gap?
An inverse fair value gap is an FVG that price has crossed and that a trader then treats as a possible reaction zone from the opposite side. For example, a failed bullish FVG may be monitored as resistance after price closes below it. This is a separate rule and must be tested separately from a first-touch FVG setup.
Is a fair value gap a buy or sell signal?
No. An FVG identifies a chart location, not a complete trade. Directional context, an entry trigger, invalidation, position size, target, costs, and a tested sample are still required. An untested FVG should be treated as a hypothesis, not a signal.
Sources and research notes
- CME Group glossary - exchange definition of a conventional price gap and price discovery terminology.
- CME Group chart types and candlesticks - OHLC construction and the distinction between candlestick and line-chart information.
- Cont, Kukanov, and Stoikov, The Price Impact of Order Book Events - empirical research on order-flow imbalance and short-horizon price changes; it does not test retail FVG rules.
- NFA Interpretive Notice 9025 - limitations of hypothetical trading results, including hindsight, liquidity, slippage, and behavior under loss.
- CFTC retail forex advisory - leverage, dealer-controlled pricing, costs, and risks in OTC forex trading.
Research completed August 24, 2026. Search intent was checked against current query suggestions and recently indexed coverage. No public keyword-volume figure was used or invented. The FVG definitions in this guide describe a popular technical-analysis framework; they are not endorsed by the cited regulators, exchange, or researchers.