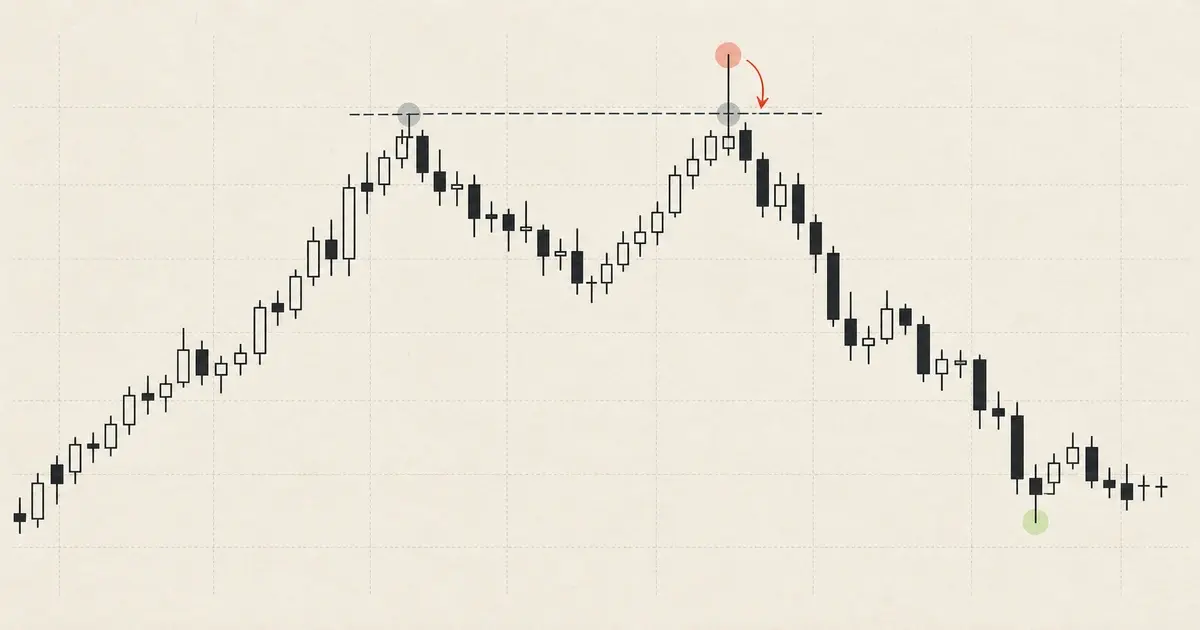
Liquidity sweep: the quick answer
A liquidity sweep happens when price trades beyond an obvious level marked in advance—such as a prior high, prior low, equal highs, equal lows, or a range boundary—and then returns through it. Traders watch the failed breach for a possible reversal. A practical setup still needs a completed-candle reclaim, an entry trigger, invalidation, a target, position size, and evidence from a relevant backtest. The candle does not prove that a bank hunted stops, and not every sweep reverses.
What does a liquidity sweep mean in trading?
Start with the ordinary meaning of liquidity. TheCME Group glossary defines it as the ability to buy or sell quickly and efficiently without causing a substantial price impact. That is a market-quality concept. It concerns available counterparties, depth, spread, and the cost of executing an order.
The phrase liquidity sweep, as used by retail price-action traders, is narrower and less formal. It describes what price did around a visible high or low. Traders assume that these areas may attract conditional orders: stops from existing positions and orders from participants trying to trade a breakout. For US stocks, Investor.gov explains that a conventional stop order becomes a market order once its stop price is reached. The exact handling differs by broker, order type, and venue; CME futures, for example, also use stop orders with a protected execution range. Read theInvestor.gov order guide and theCME futures order guide.
When price crosses a watched level and rapidly returns, the event can be useful because a breakout attempt did not hold. But the chart only records prices from a particular feed. It does not reveal every hidden order, broker-held stop, cancellation, hedge, or participant intention. A more honest description is therefore: a sweep is a failed level breach under a predefined rule.
Directly observable
The pre-existing level, the breach price, the close, the time, and the candles that followed.
Testable hypothesis
Whether a defined reclaim and confirmation produce positive expectancy after costs.
Not proven by a wick
A deliberate stop hunt, institutional identity, hidden inventory, or a future reversal.
Market-microstructure research supports the broader fact that order-book events matter. Cont, Kukanov, and Stoikov found a robust relationship between short-horizon price changes and order-flow imbalance in data from 50 US stocks. Theiroriginal study does not test the retail liquidity-sweep pattern and should not be presented as proof that a wick predicts reversal.
How to identify a liquidity sweep without hindsight
The level must exist before the breach. If a trader chooses the most convenient high or low only after the reversal, almost any chart can be labelled a perfect sweep. The following four-part definition is simple enough to record and reproduce.
Mark an objective level in advance
Require an actual breach
Wait for a completed reclaim
Apply one confirmation rule
| Element | Bearish sweep | Bullish sweep |
|---|---|---|
| Reference | Visible prior high | Visible prior low |
| Breach | Candle trades above the high | Candle trades below the low |
| Basic reclaim | Completed close back below | Completed close back above |
| Invalidation idea | Acceptance above the sweep extreme | Acceptance below the sweep extreme |
| Possible target | Range midpoint, opposite low, or fixed R | Range midpoint, opposite high, or fixed R |
Buy-side liquidity and sell-side liquidity explained
Above visible highs
Buy-side liquidity
Retail educators use this term for potential buy orders above highs: stop orders from short positions and orders from breakout buyers. If price moves above the level and then closes back below, traders may label the event a bearish liquidity sweep.
Below visible lows
Sell-side liquidity
This term refers to potential sell orders below lows: stop orders from long positions and orders from breakout sellers. If price trades below and then closes back above, traders may call it a bullish liquidity sweep.
These labels are a planning shorthand, not a live inventory report. A public order book does not necessarily display broker-held stop orders before activation, and an OTC forex or CFD chart is not a consolidated view of the entire global market. Use the high or low because it is objectively visible—not because the chart proves the quantity or owner of orders behind it.
Liquidity sweep vs breakout, liquidity grab, and stop hunt
The vocabulary is inconsistent across trading communities. Instead of arguing about names, translate every label into a rule that another person could apply to the same candles.
| Term | Possible observable rule | Useful question | What it does not prove |
|---|---|---|---|
| Liquidity sweep | Price breaches a pre-marked level and closes back through it | Did the market reject the breach under one consistent rule? | Who caused the move or whether reversal will continue |
| Liquidity grab | Often used for a fast wick beyond a high or low | Is this definition materially different from the sweep rule? | A universal distinction from liquidity sweep |
| False breakout | Price triggers a breakout rule, then returns inside the prior structure | Which exact breakout condition failed? | That every failed breakout is engineered manipulation |
| Stop hunt | A narrative that price was intentionally moved toward clustered stops | What evidence identifies intent and participants? | Institutional intent from OHLC candles alone |
| Breakout | Price satisfies a written acceptance rule beyond a level | Did price hold beyond the level for the required close, time, or distance? | That continuation must follow |
A wick through resistance is not automatically a short. It may be the first stage of a valid breakout, a reaction to scheduled news, a spread spike, or ordinary auction behavior. Waiting for a completed reclaim avoids entering merely because price touched the other side of a line.
A rule-based liquidity sweep trading strategy
The framework below is a research template, not a claim of profitability and not a live signal. Choose the values before testing and keep them fixed for the initial sample.
Define the market, timeframe, and session
Limit eligible reference levels
Define breach and reclaim
Choose the entry trigger
Define invalidation before position size
Use one exit model
Set risk and daily limits
Minimal bearish setup, written as a test
- Context: previous-day high is marked before the session.
- Event: price trades above that high during permitted hours.
- Reclaim: the same 15-minute candle closes back below the high.
- Entry: sell only if a later candle trades below the reclaim candle's low.
- Invalidation: stop above the sweep high plus the predefined buffer.
- Exit: target 2R; no discretionary trailing in this test.
- Risk: fixed account percentage with costs included.
Worked liquidity sweep example
The following numbers are hypothetical and exist only to demonstrate the calculation. They are not current market levels or a recommendation.
Prior high
2,392.00
Sweep high
2,394.10
Entry
2,388.80
Stop
2,394.30
Suppose a 15-minute gold chart has a prior high at 2,392.00. Price reaches 2,394.10, then the candle closes at 2,391.40. That satisfies the example breach-and-reclaim rule. The reclaim candle's low is 2,388.90, and a sell-stop entry is placed one increment below at 2,388.80. The invalidation is 2,394.30, slightly above the sweep extreme.
Price risk is 2,394.30 − 2,388.80 = 5.50 price units. A 2R target would be 11.00 points below the entry, at 2,377.80. That target is only meaningful if the executable instrument's contract value, spread, expected slippage, and position size are included. A visually attractive 2R chart can still have negative expectancy if the setup wins too rarely or costs consume too much of the average result.
Planned reward
11.00 price units before costs
Planned risk
5.50 price units before costs
Position size
Account risk ÷ monetary stop distance
Which markets and timeframes can be tested?
Sweeps can be defined on forex, gold, indices, stocks, futures, and crypto charts. The geometry travels; the evidence does not. A rule tested on Bitcoin from one exchange cannot be assumed to work on EUR/USD from one broker or Nasdaq futures from CME.
| Timeframe | Potential advantage | Main risk | Reasonable research use |
|---|---|---|---|
| 5 minutes | More observations and faster feedback | Noise, spread, slippage, news spikes, and execution sensitivity | Intraday tests with session and cost filters |
| 15 minutes | Balances setup frequency with some noise reduction | Still sensitive to session opens and scheduled releases | Structured intraday rules and prior-session levels |
| 1 hour | Clearer swing structure and fewer decisions | Wider stops and fewer independent samples | Intraday-to-swing tests across major sessions |
| 4 hours | Broader context and less screen time | Large price risk and slow statistical feedback | Swing rules with overnight and weekend risk controls |
For decentralized or dealer-based products, feed selection matters. The US Commodity Futures Trading Commission notes that retail OTC forex customers trade against their dealer rather than in a live, centralized exchange market. Review theCFTC forex advisory. CFD quotes and spreads can also differ from the underlying cash or futures market.
Save the provider, symbol, timezone, session template, and whether candles include extended hours. A one-tick sweep on one feed may not exist on another. If the planned execution venue does not print the setup, a screenshot from somewhere else is not an executable signal.
Why liquidity sweeps fail: seven common mistakes
The level was chosen after the reversal
This is hindsight, not a repeatable setup. Timestamp levels before price reaches them.
The trader enters on the first wick
Without a completed reclaim, the move may still be an active breakout.
Every high and low is labelled liquidity
Unlimited levels create unlimited discretion. Restrict the eligible set.
A reclaim is treated as guaranteed reversal
Price can reclaim briefly, retest the extreme, and continue through it.
News and session opens are ignored
Fast repricing can overwhelm a small technical level and produce severe slippage.
Stops are tightened to increase size
A stop belongs beyond tested invalidation, not wherever a desired lot size requires.
Only perfect screenshots are saved
A study without failed, missed, and ambiguous examples cannot estimate real performance.
The most dangerous sentence: “They took my stop.”
That explanation can hide a simpler error: the stop was placed at an obvious level without a tested buffer, the position was too large, or the trade remained open through an event it was not designed to survive. You do not need to know another participant's motive to improve the rule. Record the maximum adverse excursion, spread, volatility, and whether the original setup was still valid.
How to backtest a liquidity sweep strategy
A collection of screenshots is a study notebook, not yet a backtest. The test needs explicit eligibility rules, a chronological sample, realistic costs, and outcomes recorded in the same way for winners and losers.
- 01
Freeze version 1.0
Write the level, breach, reclaim, confirmation, entry, stop, target, session, and exclusion rules before reviewing results.
- 02
Use chronological data
Move forward candle by candle so later information cannot influence the decision. Do not begin with famous reversal days.
- 03
Record every eligible event
Include wins, losses, no-fills, skipped news events, duplicate sweeps, and trades that hit stop before target.
- 04
Model friction
Deduct spread, commission, financing where relevant, and a conservative slippage estimate. Short-timeframe results are especially sensitive.
- 05
Measure more than win rate
Track expectancy in R, average win, average loss, profit factor, maximum drawdown, consecutive losses, MAE, MFE, and rule adherence.
- 06
Separate development and validation
Create the rule on one period, then test it without changes on later data and, if appropriate, a second related market.
- 07
Forward-test before risking money
Use live incoming data and simulated execution to check whether alerts, timing, spread, and discipline match the historical assumptions.
Expectancy in R
(win rate × average win R) − (loss rate × average loss R)
Positive historical expectancy is necessary for the test, but it is not a promise that the same distribution will continue.
Do not optimize every filter
Repeatedly changing the level, ATR threshold, session, confirmation, stop, and target until history looks perfect increases the probability of backtest overfitting. Bailey and colleagues explain this statistical problem inThe Probability of Backtest Overfitting.
There is no magical sample size that proves an edge. Fifty trades can reveal basic implementation problems; one hundred or more provide a more stable description, but dependence between trades, changing regimes, and rare losses still matter. Prefer a simple rule that survives new data over a complex rule that explains every old chart.
Liquidity sweep pre-trade checklist
The trade remains “no setup” until every required item passes.
- The level was defined before price reached it.
- The exact market, feed, timeframe, and session are correct.
- Price breached the level by the minimum required amount.
- A completed candle satisfied the reclaim rule.
- The required confirmation occurred; I am not anticipating it.
- No exclusion rule, including scheduled news, is active.
- Entry, invalidation, target, and maximum holding time are written.
- Position size respects the account-risk limit after costs.
- The available reward meets the tested minimum.
- I will save the trade even if it loses or never fills.
Live beta
Get a second opinion on a chart
The AI Market Analyzer checks several rule sets, including liquidity-sweep reversal. Its output is educational analysis, not a trade signal or order.
Open AI Market AnalyzerRisk tool
Calculate position size before entry
Convert account risk and stop distance into a position size across forex, indices, commodities, crypto, stocks, futures, and custom instruments.
Use the trading calculatorLiquidity sweep trading FAQ
What is a liquidity sweep in trading?
A liquidity sweep is a chart event in which price trades beyond a level that was visible beforehand, such as a prior swing high, swing low, equal high, equal low, or range boundary, and then returns through that level. Traders often interpret the failed breach as useful context, but the pattern does not identify who traded or guarantee a reversal.
Is a liquidity sweep the same as a liquidity grab?
The terms are often used interchangeably, and no universal market definition separates them. Some traders use liquidity grab for a fast, single-wick rejection and liquidity sweep for a broader move through several levels. If you test either concept, define it with prices and completed candles rather than relying on the label.
What is buy-side and sell-side liquidity?
In retail chart vocabulary, buy-side liquidity refers to potential buy orders associated with visible highs, including buy stops and breakout orders. Sell-side liquidity refers to potential sell orders associated with visible lows. A chart shows traded prices, not a complete map of every broker's hidden or conditional orders, so these are hypotheses about where orders may activate.
How do you confirm a liquidity sweep?
A basic confirmation is a completed candle that trades beyond a pre-marked level and closes back through it. A stricter rule can also require the next candle to break a local swing in the reversal direction. Confirmation reduces ambiguity, but it also produces later entries and sometimes wider stops.
What is the difference between a liquidity sweep and a breakout?
A sweep fails to hold beyond the referenced level and reclaims it; a breakout is accepted beyond the level under the trader's written definition. One close is not always enough to determine acceptance, so the rule might require two closes, a retest, time beyond the level, or a volatility-adjusted distance.
Does every liquidity sweep reverse?
No. Price can briefly reclaim a level and then continue through it, or the apparent sweep can be ordinary volatility around a weak level. A sweep is not a standalone signal. Directional context, confirmation, invalidation, costs, position sizing, and results from a relevant test sample are still required.
What is the best timeframe for liquidity sweeps?
There is no universally best timeframe. Five-minute charts create more observations but are more sensitive to spread, slippage, and noise. Fifteen-minute, one-hour, and four-hour charts produce fewer setups and usually wider price risk. Test each market and timeframe as a separate strategy.
Do liquidity sweeps work in forex, crypto, gold, and indices?
Visible highs and lows can be breached in any charted market, but that does not mean one rule has the same expectancy everywhere. Trading hours, price feeds, volatility, spreads, order handling, and market structure differ across forex, CFDs, crypto venues, stocks, and futures. Validate each instrument with its actual executable data and costs.
Where should a stop loss go on a liquidity-sweep setup?
One testable approach places invalidation beyond the sweep extreme plus a predefined buffer. Another exits if price closes back beyond the referenced level. The correct choice depends on the tested rules, instrument, spread, and volatility; the stop should be defined before entry and used to calculate position size.
Is a liquidity sweep proof of a stop hunt?
No. A candle can show that price crossed a level, but not the identity or intention of every participant. Stops, market orders, limit orders, cancellations, hedging, news, and ordinary price discovery can all contribute. Calling every breach a deliberate stop hunt adds a story that the chart alone cannot verify.
Sources and editorial methodology
This guide separates exchange and regulator definitions from retail chart terminology. Strategy Archive found no universal exchange definition or peer-reviewed validation for the retail liquidity-sweep setup itself. For that reason, the article presents the pattern as a testable hypothesis rather than a proven market mechanism.
- CME Group glossary — liquidity, limit orders, and stop-order terminology.
- Investor.gov: Types of Orders — market, limit, and stop orders for securities.
- CME Group: Futures Order Types — venue-specific stop and stop-limit mechanics.
- Cont, Kukanov & Stoikov — primary research on order-flow imbalance and short-horizon price impact.
- Bailey, Borwein, López de Prado & Zhu — primary research on the probability of backtest overfitting.
- CFTC retail OTC forex advisory — dealer-based pricing, leverage, deposits, and fraud risk.
Educational examples were created to explain rule construction; they are not historical performance claims. Review the Strategy Archiveeditorial policy andrisk disclaimer for how this material is prepared and limited.
Bottom line
A liquidity sweep is useful only after the story is converted into rules. Mark the level before the move, define the breach and reclaim, wait for the chosen confirmation, place invalidation where the idea is actually wrong, and size the trade from that distance. Then test every occurrence—not only the clean examples. Until the resulting expectancy survives costs and new data, the setup is a research hypothesis, not an edge.