Short answer
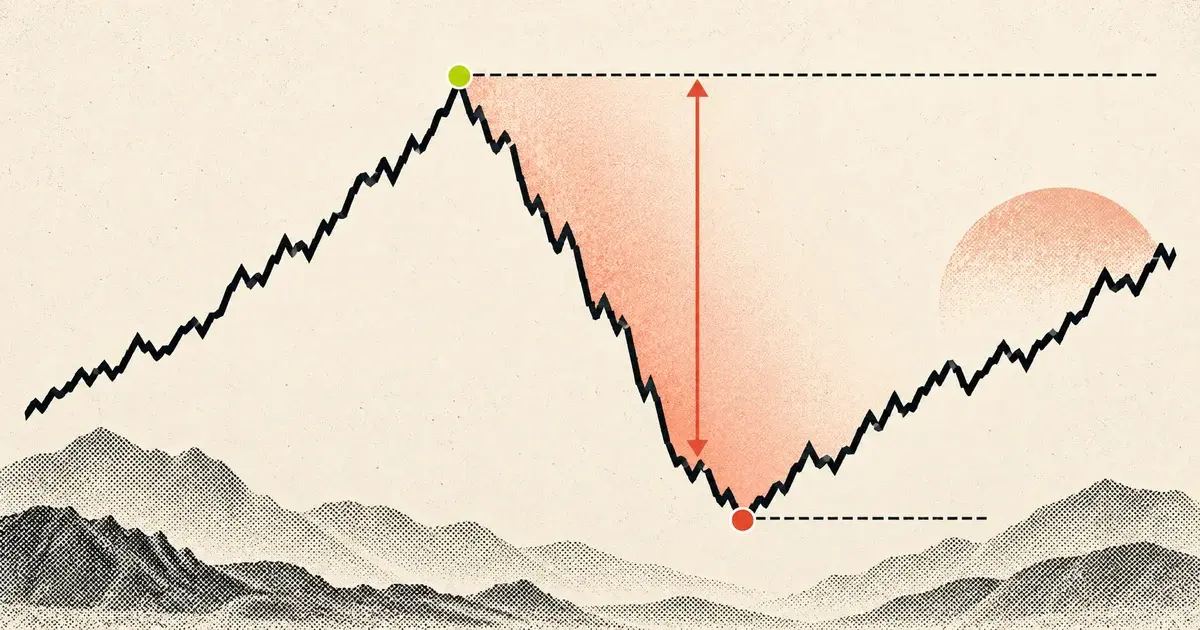
Maximum drawdown is the largest decline from an equity peak to a later trough in a chosen period. Calculate it as (trough − peak) ÷ peak × 100. A drop from $100,000 to $82,000 is an 18% drawdown. It then takes a 21.95% gain on the remaining $82,000 to return to the old peak. The metric is useful only when the equity definition, timeframe, deposits, withdrawals, open positions, and trading costs are consistent.
What maximum drawdown actually measures
At every point on an equity curve, the running peak is the highest value recorded up to that time. Current drawdown is the percentage distance below that peak. Maximum drawdown, or MDD, is the deepest of those declines during the measured sample.
Current drawdown
(current equity − running peak equity) ÷ running peak equity × 100
Maximum drawdown
The most negative current-drawdown value observed in the chosen period. Some reports show the magnitude as a positive number, so −18% may be displayed as 18%.
The academic literature commonly describes maximum drawdown as the largest cumulative loss from peak to trough. Goldberg and Mahmoud also note that drawdown captures path information that volatility can miss; the order of returns matters. See their primary paper, Drawdown: From Practice to Theory and Back Again.
Worked example: peak, trough, and new high
Peak equity
$50,000
Later trough
$43,500
Drawdown
13.00%
The dollar decline is $6,500. Divide that by the $50,000 peak: $6,500 ÷ $50,000 = 0.13, or 13%. If equity later climbs to $47,000, the drawdown is still active because the account has not reached a new high. It ends only when equity returns to $50,000 or above.
Deposits and withdrawals can distort the curve. A $5,000 deposit is not trading profit and should not create a false new peak. Use a time-weighted series or adjust cash flows consistently when the goal is to evaluate strategy performance.
Why recovery requires more than the percentage lost
Recovery is measured from the smaller post-loss base. The formula is drawdown ÷ (1 − drawdown), with the percentage entered as a decimal. This is arithmetic, not a forecast of how quickly recovery will happen.
| Drawdown | Capital remaining | Required recovery |
|---|---|---|
| 5% | 95% | 5.26% |
| 10% | 90% | 11.11% |
| 20% | 80% | 25.00% |
| 30% | 70% | 42.86% |
| 40% | 60% | 66.67% |
| 50% | 50% | 100.00% |
Reducing position size during drawdown may slow both further losses and recovery. Increasing size to “win it back” changes the strategy's risk distribution and can turn an ordinary losing sequence into account failure.
Test the numbers with the free drawdown recovery calculator, which also shows how current capital changes the dollar risk per trade.
Drawdown definitions that should not be mixed
| Measure | Reference | What it can hide | Use |
|---|---|---|---|
| Balance drawdown | Closed-trade account balance | Open losses and intratrade stress | Reviewing realized results |
| Equity drawdown | Balance plus unrealized P&L | Feed and mark-price differences | Monitoring live account risk |
| Absolute drawdown | Often initial capital | Later peak-to-trough decline | Capital loss relative to start |
| Maximum drawdown | Highest prior peak in the sample | What happens outside the sample | Worst observed historical decline |
| Static limit | Fixed account reference | Intraday path if checked only at close | A fixed risk boundary |
| Trailing limit | A moving balance or equity high | Provider-specific resets and locking rules | Dynamic funded-account control |
Do not compare a close-to-close backtest drawdown with a broker's intraday equity limit as if they were the same statistic. State the sampling frequency, valuation price, timezone, costs, treatment of open trades, and cash-flow adjustment beside every reported number.
Depth is only half of the drawdown story
Drawdown depth
How far equity fell below the previous peak. It affects capital, margin, position size, risk tolerance, and the mathematical recovery required.
Drawdown duration
How long the account remains below the peak, measured in days or trades. It affects confidence, capital availability, and whether the strategy still fits the trader's horizon.
Two systems can both have a 12% maximum drawdown while creating very different experiences. One may recover after 20 trades; the other may remain underwater for a year. Record time to trough, time to recovery, and the longest flat period alongside maximum depth.
What is an acceptable maximum drawdown?
A universal cutoff would be misleading. Start from the loss you can financially and behaviorally tolerate, then work backward into position risk. A strategy is not automatically better because its historical MDD is smaller; it may also have lower return, less history, hidden open risk, or an overfit backtest.
Capital constraint
Could this money be needed during the expected recovery period?
Leverage
Can margin calls or liquidation occur before the planned stop?
Strategy evidence
How many regimes, trades, costs, and out-of-sample observations support the estimate?
Concentration
Can correlated positions lose together even if each trade is sized correctly?
Operational limit
Does the broker, fund, or evaluation use stricter intraday rules?
Behavioral limit
Would this decline cause you to abandon or modify the plan at the worst time?
How to read maximum drawdown in a backtest
Backtest MDD is the worst decline the simulation happened to observe. It is not a ceiling. The estimate depends on sample length, market regimes, data quality, execution assumptions, position sizing, and every rule chosen after looking at the data.
- 01
Rebuild the equity curve after all costs
Include spread, commission, financing, slippage assumptions, rejected orders, and the position-sizing method actually used.
- 02
Use equity at a meaningful frequency
Trade-close values can miss severe intratrade drawdown. For leveraged strategies, inspect bar-by-bar or event-level equity where data allows.
- 03
Separate development from validation
Freeze the strategy, then measure it on unseen data. Repeatedly tuning rules to reduce old drawdown creates selection bias.
- 04
Stress the sequence
Resample trades, widen realistic costs, delay entries, and test correlated losses. The aim is a range of plausible drawdowns, not one precise forecast.
- 05
Compare depth, duration, and return
Report recovery time, longest underwater period, losing streak, exposure, and return beside MDD.
Bailey and colleagues show why selecting the best result from many tested configurations raises the probability of backtest overfitting. Read the primary paper, The Probability of Backtest Overfitting, then use this backtesting versus forward-testing guide to structure validation.
A three-layer drawdown control plan
Trade layer
Size from account risk and the invalidation distance. Include correlated open risk and never widen the stop to avoid recording a loss.
Session layer
Define a maximum realized-plus-unrealized session loss, a maximum number of execution errors, and the time when the session resets.
Strategy layer
Set evidence-based review and retirement rules using expectancy, costs, adherence, drawdown depth, duration, and out-of-sample behavior.
Example review rule—not a recommendation
“Pause new risk when live equity drawdown reaches the lower of the account's operational limit or the 95th percentile from the predefined resampling study. First audit data, fills, costs, and rule adherence. Resume only under the written review process.” The percentile, sample, and operational buffer must be designed for the actual strategy; copying a percentage from another trader provides no evidence.
Build these limits into a complete written trading plan and calculate each position before entry with the position-size calculator.
Maximum drawdown in prop-firm rules
A displayed account size is not the same as usable risk capital. In an evaluation or funded program, the practical buffer is the distance to the breach level. Daily loss, overall loss, static drawdown, trailing drawdown, balance, and equity can all be calculated differently.
Before paying a fee, write down the exact reference value, whether open P&L counts, the timezone and reset time, whether the limit trails intraday or at end of day, whether it locks, and what happens after a breach. Terms can change; use the provider's current rulebook, not a screenshot or an old comparison article.
For a broader decision framework, compare prop firms with personal accounts and review the prop-firm challenge risk plan.
Drawdown reporting checklist
- State the start and end date of the sample.
- Define whether the curve uses balance or equity.
- Identify the valuation price and sampling frequency.
- Adjust deposits and withdrawals consistently.
- Include realistic trading and financing costs.
- Report peak date, trough date, and recovery date.
- Show maximum depth and longest duration.
- Separate in-sample, out-of-sample, and live results.
- Record leverage and correlated open exposure.
- Treat historical MDD as an estimate, not a guarantee.
Maximum drawdown FAQ
What is maximum drawdown in trading?
Maximum drawdown is the largest percentage decline from an equity peak to a later trough during a defined period. It describes the worst observed decline in that sample, not the loss a strategy is guaranteed to stay below in the future.
How do you calculate maximum drawdown?
Track the running equity peak, calculate each decline as (current equity minus running peak) divided by the running peak, and select the most negative result. A fall from $100,000 to $82,000 is an 18% drawdown.
Why does a 20% drawdown require a 25% recovery?
After a 20% loss, 80% of the peak remains. Recovering the missing 20 from a base of 80 requires 20 divided by 80, or 25%. Recovery percentages accelerate as drawdowns deepen.
What is a good maximum drawdown?
There is no universal good percentage. A tolerable drawdown depends on the strategy, leverage, liquidity, time horizon, capital needs, historical sample, and the trader's ability to follow the plan. Compare drawdown with return, duration, costs, and the uncertainty outside the test sample.
Should drawdown use balance or equity?
For live risk control, equity is usually more informative because it includes unrealized gains and losses. Balance-only drawdown can hide open risk. Platforms and prop firms may define these terms differently, so their written formula and reset time are authoritative for their account.
Is drawdown the same as a losing streak?
No. A losing streak counts consecutive losing trades. Drawdown measures the decline from the latest equity peak and can include alternating wins and losses. A strategy can have a long drawdown without a long consecutive-loss streak.
What is drawdown duration?
Drawdown duration is the time or number of trades from an equity peak until the equity curve reaches a new high. Depth and duration answer different questions: how much capital was lost and how long the strategy remained underwater.
Can a backtest predict future maximum drawdown?
No. Historical maximum drawdown is one observation from one sample. Future conditions, execution costs, leverage, strategy changes, and rare sequences can produce a deeper or longer drawdown. Use historical drawdown as evidence for stress testing, not as a hard forecast.
What is the difference between static and trailing drawdown?
A static limit remains anchored to a fixed reference. A trailing limit rises as the account reaches new equity or balance highs, depending on the rule. Some trailing limits stop moving after a threshold; others do not. Always use the provider's exact formula.
When should a trader stop during a drawdown?
The stopping rule should be written before the loss. Pause immediately for execution errors, rule violations, data problems, or a breached account limit. A strategy review is justified when live results move outside a predeclared tolerance supported by the test sample, not merely after an arbitrary number of losses.
Sources, method, and limits
The formulas and worked examples in this guide are reproducible arithmetic. The research sources support the definition, path-dependent nature of drawdown, backtest-selection risk, and the dangers of leveraged products. They do not establish a universal safe drawdown.
- Goldberg & Mahmoud, Drawdown: From Practice to Theory and Back Again — definition, path dependence, and conditional expected drawdown.
- Bailey et al., The Probability of Backtest Overfitting — selection bias from testing many strategy configurations.
- CFTC retail OTC forex advisory — leverage, dealer pricing, fees, and retail forex risk.
- CFTC virtual currency trading advisory — volatility and leverage amplification in margined products.
- Investor.gov order-type bulletin — stop orders, execution uncertainty, and trailing-stop mechanics.
Examples are educational and are not performance claims, personal risk limits, or trade signals. Historical drawdown does not bound future loss. Leveraged trading can produce rapid losses, and order execution may differ from the planned stop. Read the editorial policy and risk disclaimer.
Bottom line
Maximum drawdown is a description of the worst observed path, not a promise about the next one. Calculate it from a consistent equity series, pair depth with duration, stress results beyond the historical sample, and convert the uncertainty into trade, session, and strategy limits written before money is at risk.
Calculate drawdown and recovery